Have you ever wanted an easier way to find top skill areas for development and investment, or gain valuable insights into the capabilities of the different segments of your workforce?
We’re excited to announce a new way for Skills Base Enterprise license holders to rapidly identify and visualize skill and competency gaps.
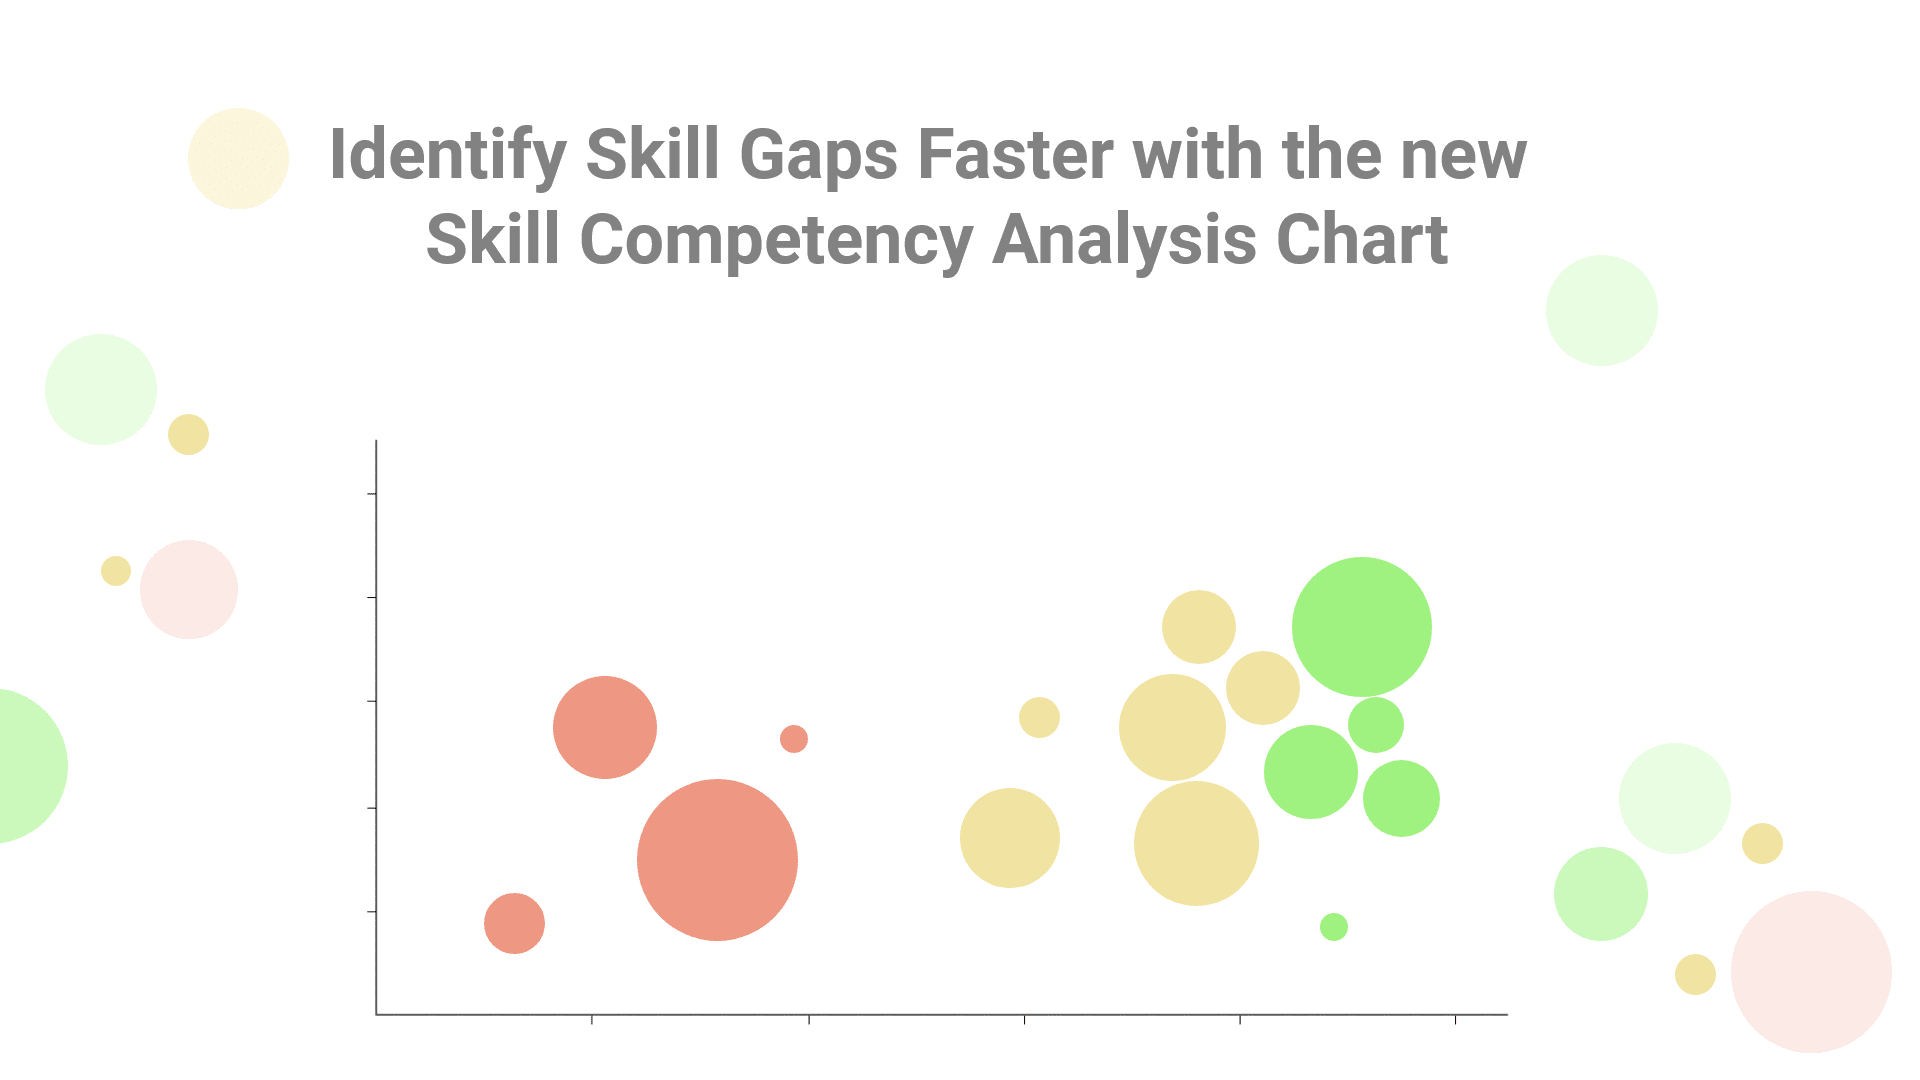
In addition to the trusted real-time Skills Matrix and skills matrix reporting functionality there is now an additional option to see and plot skill and competency levels on a bubble chart.
Using the new chart you can drill down through each skill category to isolate and analyze specific groups of skills within an entity (team, role or location). And, the chart can also be configured to display data based on skill targets assigned to the viewed entity, or individuals’ targets which could come from any source.
The chart is also accompanied by the raw data which can be viewed and sorted easily.
How do I interpret the Skill Competency Analysis Chart?
This visual representation facilitates rapid identification of gaps and strengths, as well as the volume of skills across different parts of the organization. For more detailed information visit the knowledge base article on this new feature.
Interpreting Competency Level – Bubbles towards the right mean higher competency level, whereas towards the left means a lower competency level
Interpreting Skill Level – Higher bubbles mean higher skill level while lower bubbles mean lower skill level.
Interpreting Skill Volume – Larger Bubbles mean more people with skills, smaller bubbles mean less people with the skill.
Interpreting Competency Volume – Green bubbles mean many people are fully competent while Red bubbles mean fewer people are fully competent.
How do I get access to this new feature?
The new Skill Competency Analysis chart is available to all Enterprise license holders. If you need help setting it up for your organization feel free to reach out to talk to the team.
If you are currently on a free or self-service licence, schedule a demo with the team to see if it’s something that might be of use for your organization.
